Build a graph from your event-stream with Go and ArangoDB
Transform event streams into insightful graphs with Go and ArangoDB. Emin's guides us with a practical walkthrough on structuring nodes and edges, converting events to graph data, and leveraging ArangoDB’s flexibility to analyze user behavior and data connections effectively.

Is this one of those “Amplitude vs Mixpanel” catfights? No, this is the “build-your-own vs use-existing-tools” everlasting struggle.
I exaggerated a bit with the intro. There will be no deep dives, no excruciating comparisons, no this versus that in this article. Not that kind of article. This is just a description and a walkthrough of a fun research project I did, with some conclusions that stemmed from it.
In this article, we will go through a possible need for analyzing your event stream, how to build a graph from your event stream, and describe a service that will do all of the work. Finally, we will review some conclusions that I made while working on this project. All of this will be observed from a standpoint of events that are generated by the user actions in an application or a system.
The problem with events
If your system is generating events that are stored or processed by some part of your system, there is a very good chance that a stream of some of those events could represent user behavior. There is a good chance that your event store contains, or will contain, the information you need on the behavior of your users.
The problem is that an event store, an event stream, or any type of series of events are really hard to analyze by just looking at them. Sure, you can write a function, one or many services, that will process events. You can even use already existing tools, frameworks, platforms like Amplitude or Mixpanel. All of the mentioned means are very good options if you know what you are looking for. User retention charts and diagrams are just a few steps away with some of the mentioned tools and platforms, but you will need to know which events to include in your charts and diagrams.
You can even generate the data from your event stream and store it in a relational database, but you will run into the same problem. You will have to know what you are looking for while writing a query. You can check out the ERD diagram, which shows you the relations between different tables, but it doesn’t provide the bird’s-eye view on how the actual data is linked.
Is there another way to do all of the above? Yes, we can build a graph. A graph will also provide a bird’s-eye view of all the data and how it’s all linked together. We won’t go into much detail on graphs in this article, but here is a definition of what a graph is.
In discrete mathematics, a graph is defined as set of vertices and edges. In computing it is considered an abstract data type which is really good to represent connections or relations — unlike the tabular data structures of relational database systems, which are ironically very limited in expressing relations.
A good metaphor for graphs is to think of nodes as circles and edges as lines or arcs. The terms node and vertex are used interchangeably here. Usually vertices are connected by edges, making up a graph. Vertices don’t have to be connected, but they may also be connected with more than one other vertex via multiple edges. You may also find vertices connected to themselves. — taken from the ArangoDB crash course
So, a vertex (or a node) is a fundamental unit of a graph. An edge is also a fundamental unit of a graph that is linking two vertices. From a relational database standpoint, a vertex is like a table row and an edge is a relation between table rows either from the same or different tables. With this structure, graphs are built for edge traversals and relationship searches between vertices.
How to go from events to a graph?
It’s quite simple. When designing a service or a function that does the actual conversion, you will have to keep in mind a couple of things. To describe the process, I will be using some of the events from the service I built. You can find a detailed description of the service here.
Before you start with building a service (or a function) that will convert the event data from your event stream or your event store to graph data, you will have to go over all of your events and sort them into two groups: creational events and relational events.
A creational event is a type of event that is a direct result of an action that created a new entity in your domain model, a direct result of some action that adds a new piece of data. For example, events like user_registered or item_created. Events like these will be converted into corresponding vertices when added to a graph. In addition to creating a vertex in the targeted graph, events that have a potential created_by link will have an additional side-effect of creating an edge between two vertices. An example of this case is item_created event. This should only be taken into consideration if a specific event is not generated when the link between an object and its creator is created. This is not covered in the example service, but it’s worth mentioning that side-effects like these need to be considered if they are not covered by separate events.
A relational event is a type of event that creates a relation between two entities. For example, events like item_viewed, item_purchased, item_delivered, etc. The events like these will be converted into edges that will either create a link between two vertices or link a vertex to itself.
That’s it! Now that you have sorted our events, it’s time to pick your tools, libraries, and graphs for building your conversion service or a function.
Project overview
There will be no deep dives in tools, libraries, programming languages, and available graph databases. Use whatever tools, libraries, programming languages you are comfortable with. To choose a graph database you want, there is an abundance of resources out there like comparisons and rankings. Just please check for compatibility between graphs and languages, drivers, libraries, etc.
In this section, we will go over my choices for this project. Go is an obvious one because I love Go and that’s that. I used watermill library in some of my work-related projects and it’s been a great experience. To be fair, there is a bit of learning curve behind it, but it provides a big variety of functionalities for event-driven scenarios. This time, I used it to create a little “random” event generator and to simulate a stream of incoming events. By using the watermill’s GoChannel structure both as a publisher and a subscriber, I was able to create a pipeline that generated events through multiple queues, which were then processed by corresponding handlers.
For a graph database, I choose ArangoDB. It had everything I needed in a graph database. And more. It’s a multi-model database, fairly easy to set up, and well documented. It has an easy-to-learn query language (AQL), easy-to-use Go driver, cool web interface to work with, etc. Best of all, it’s a schema-free graph database, so it’s very flexible. You can store data on the edges as well, which is pretty cool. To be fair, this is nothing new as many existing graph databases have this feature.
Below you can take a peek at how the graph is created.
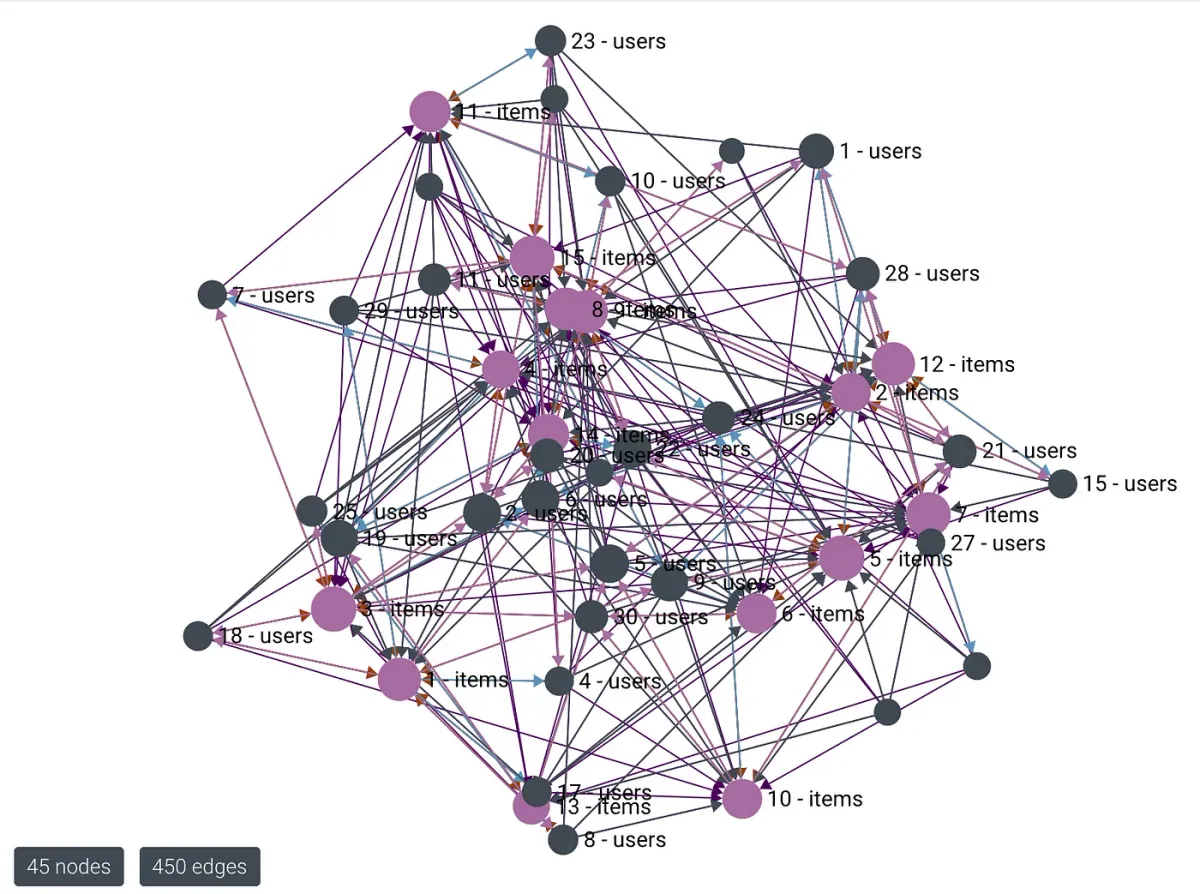
To access all of the code, please visit my repo. There is a docker-compose setup there that will initialize service and database containers, and run the service that will generate the events and convert them to graph data. Detailed steps to access the ArangoDB web interface and manage the graph data are described in the repo. When the service is finished, the graph should look something like this:

Conclusion and a reality check
Graphs provide a flexible way to analyze and query your data as they are built for searching. But, is it something that will disrupt the current scene of data analytics tools? Are we on the verge of a new build-your-own craze like it was with the Javascript frameworks not long ago?
The short answer is no. Not yet at least. Since most of the scenarios focus on user retention and basic product analytics, the best way to quickly set up your data analytics pipeline is to use platforms like Amplitude, Mixpanel, etc. They are easy to set up, have a lot of options and services to offer for analyzing your data and observing user behavior, and have great support when you get stuck.
However, graphs are slowly making it as an important contender in the database world. They certainly have their use and have widespread usage in analytics as well, but they might be a better fit for more mature products and projects. Taking this project showcase as an example, the setup doesn’t have a plug&play flow as the mentioned platforms. There are some things to consider when trying to convert event data to graph data, like sorting out and mapping events. It’s much easier if you have an event store or a replayable event stream, but it does take a significant amount of time, which might not be suited for startups and projects in their early stages.
To conclude, converting your event stream data to graph data has a lot of potential. I had a lot of fun working on this project and learning about ArangoDB. This has been a showcase of one possible way of converting event data to graph data. I would appreciate it to hear from you on other ways to do it.


